The one-line brief
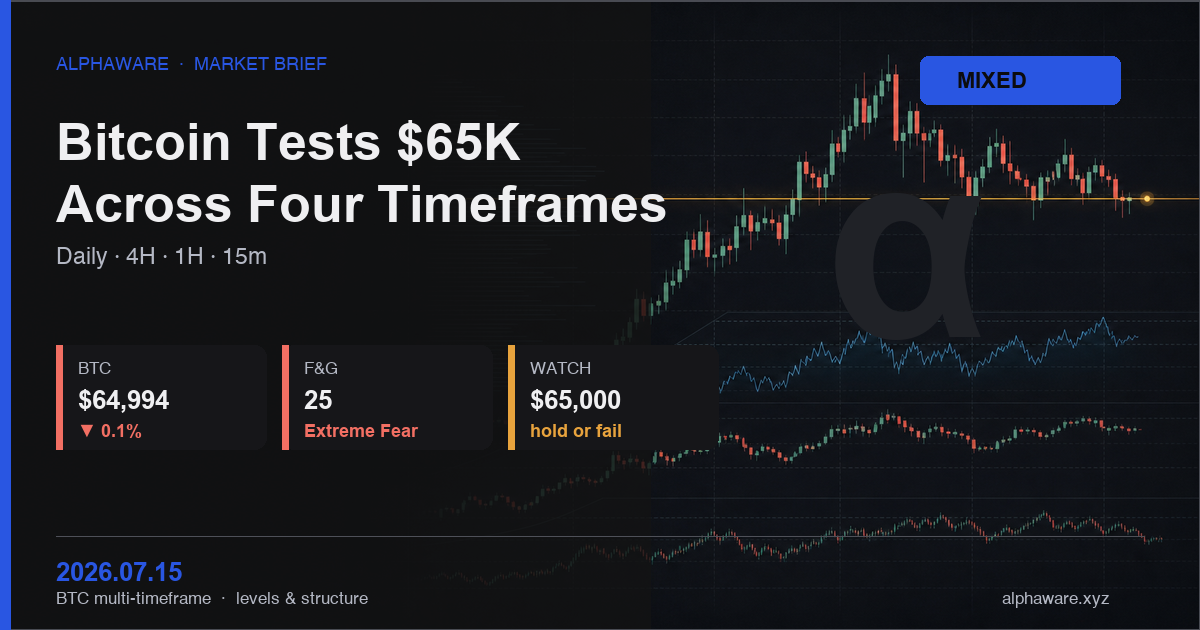
BTC is at a point where the $65,000 level needs to be checked across four separate timeframes. A short rebound or selloff is not a trend change until the daily, 4-hour, 1-hour, and 15-minute views tell a consistent story.
In this snapshot, BTC is about $64,994, down 0.1% over 24 hours. Fear & Greed is 25 (Extreme Fear), 7-day ETF flow is -$227.26M, while funding remains positive at +0.0100%. Sentiment, spot flow, and leverage are not aligned.
BTC — each timeframe has a different job
Daily: the range and the reference level
The daily chart is not for judging today’s short move; it establishes the range in which that move occurs. The 7-day range in this snapshot is $61,705 to $65,100. A rally in the lower timeframes is not a new uptrend unless the daily view can reclaim and hold the upper area.
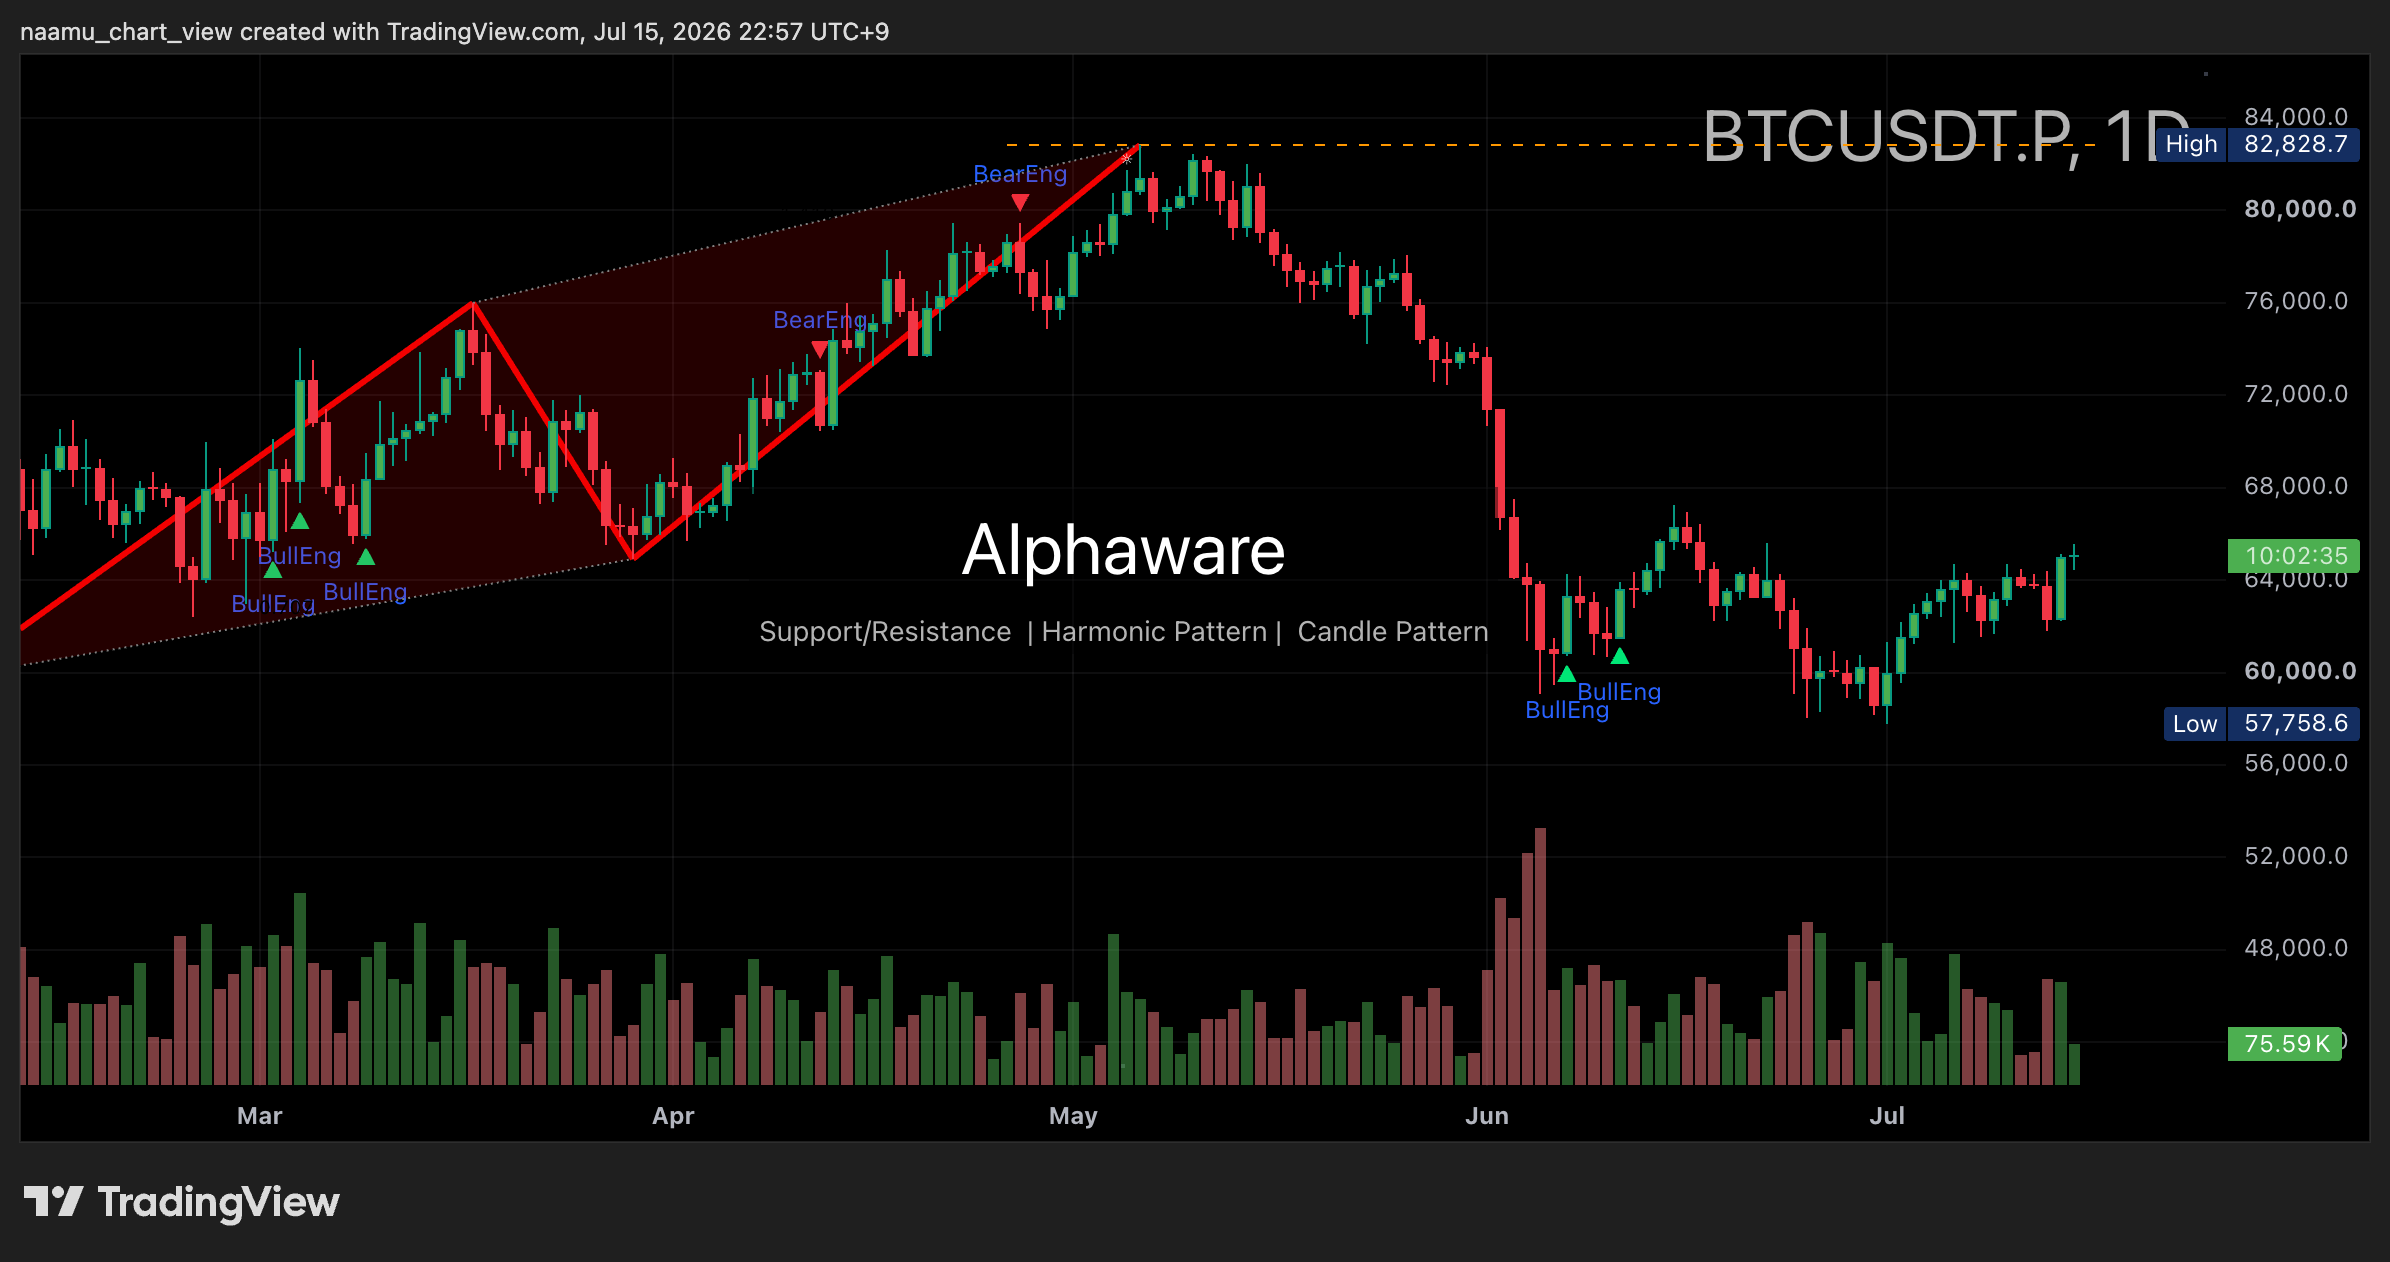
BTC daily: separate the larger reference range from short-term volatility.
4-hour: structure around $65,000
The 4-hour chart is the key view for whether BTC can hold near $65,000 and stay above the upper area after a recovery. A momentary move above $65,100 is not enough. The candle range and the ability to remain above that level matter together.
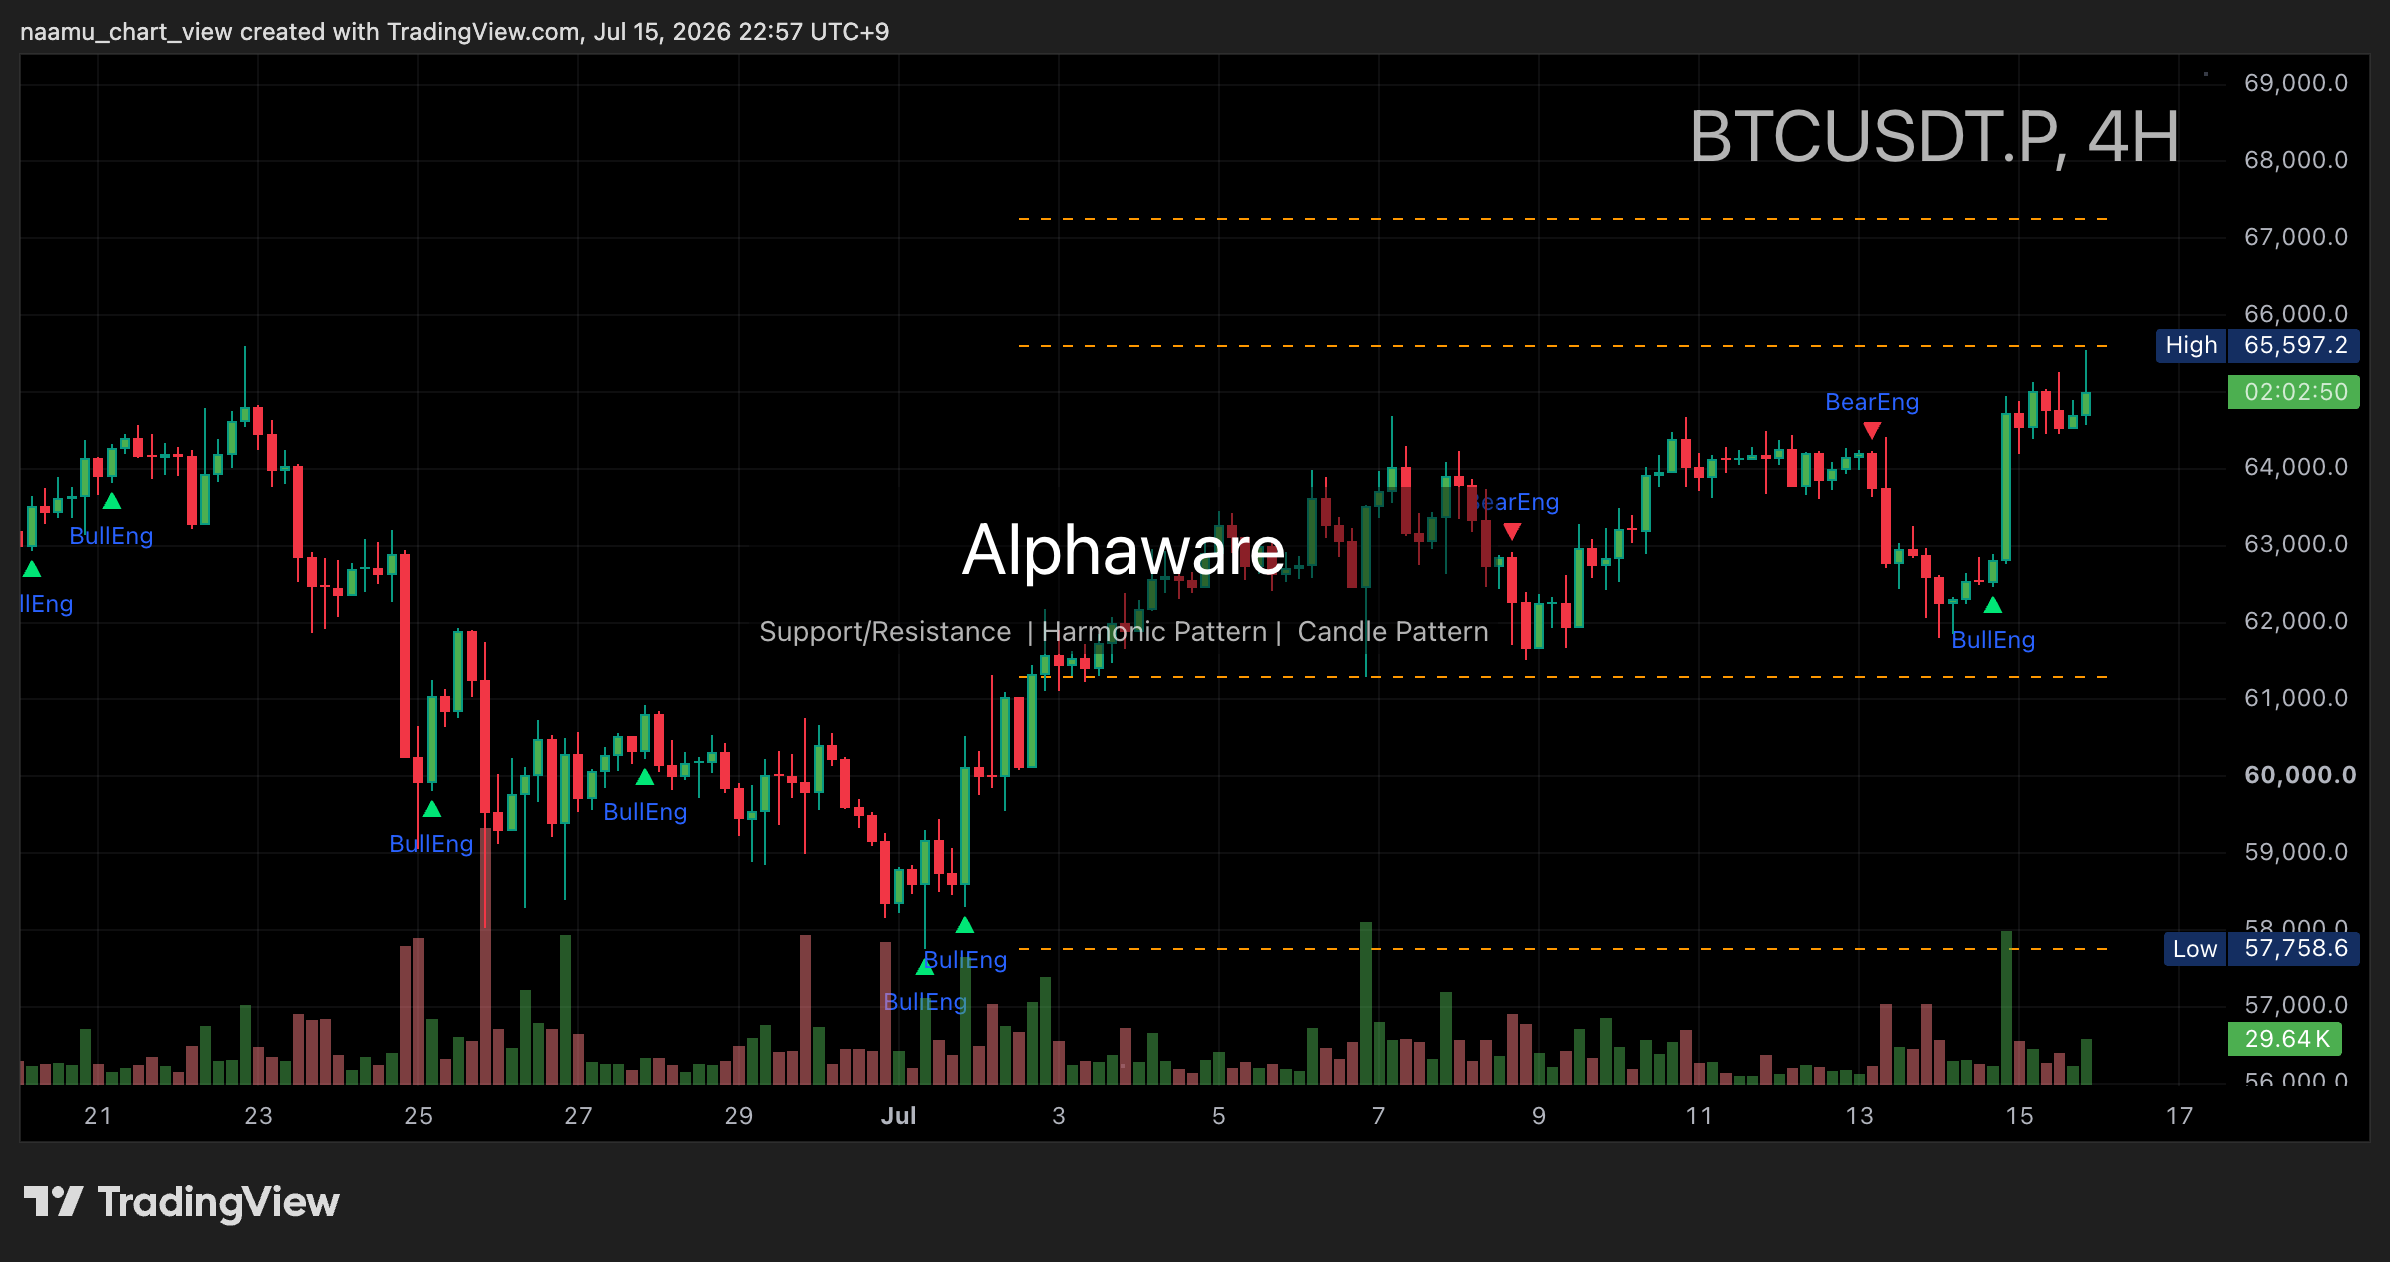
BTC 4-hour: separate a sustained recovery at $65,000 from a simple bounce.
1-hour: link short volatility to the larger structure
The 1-hour chart checks whether 15-minute volatility is actually damaging the 4-hour structure or being absorbed as noise. It should not decide direction on its own; failure to recover after breaking the 4-hour reference matters more.
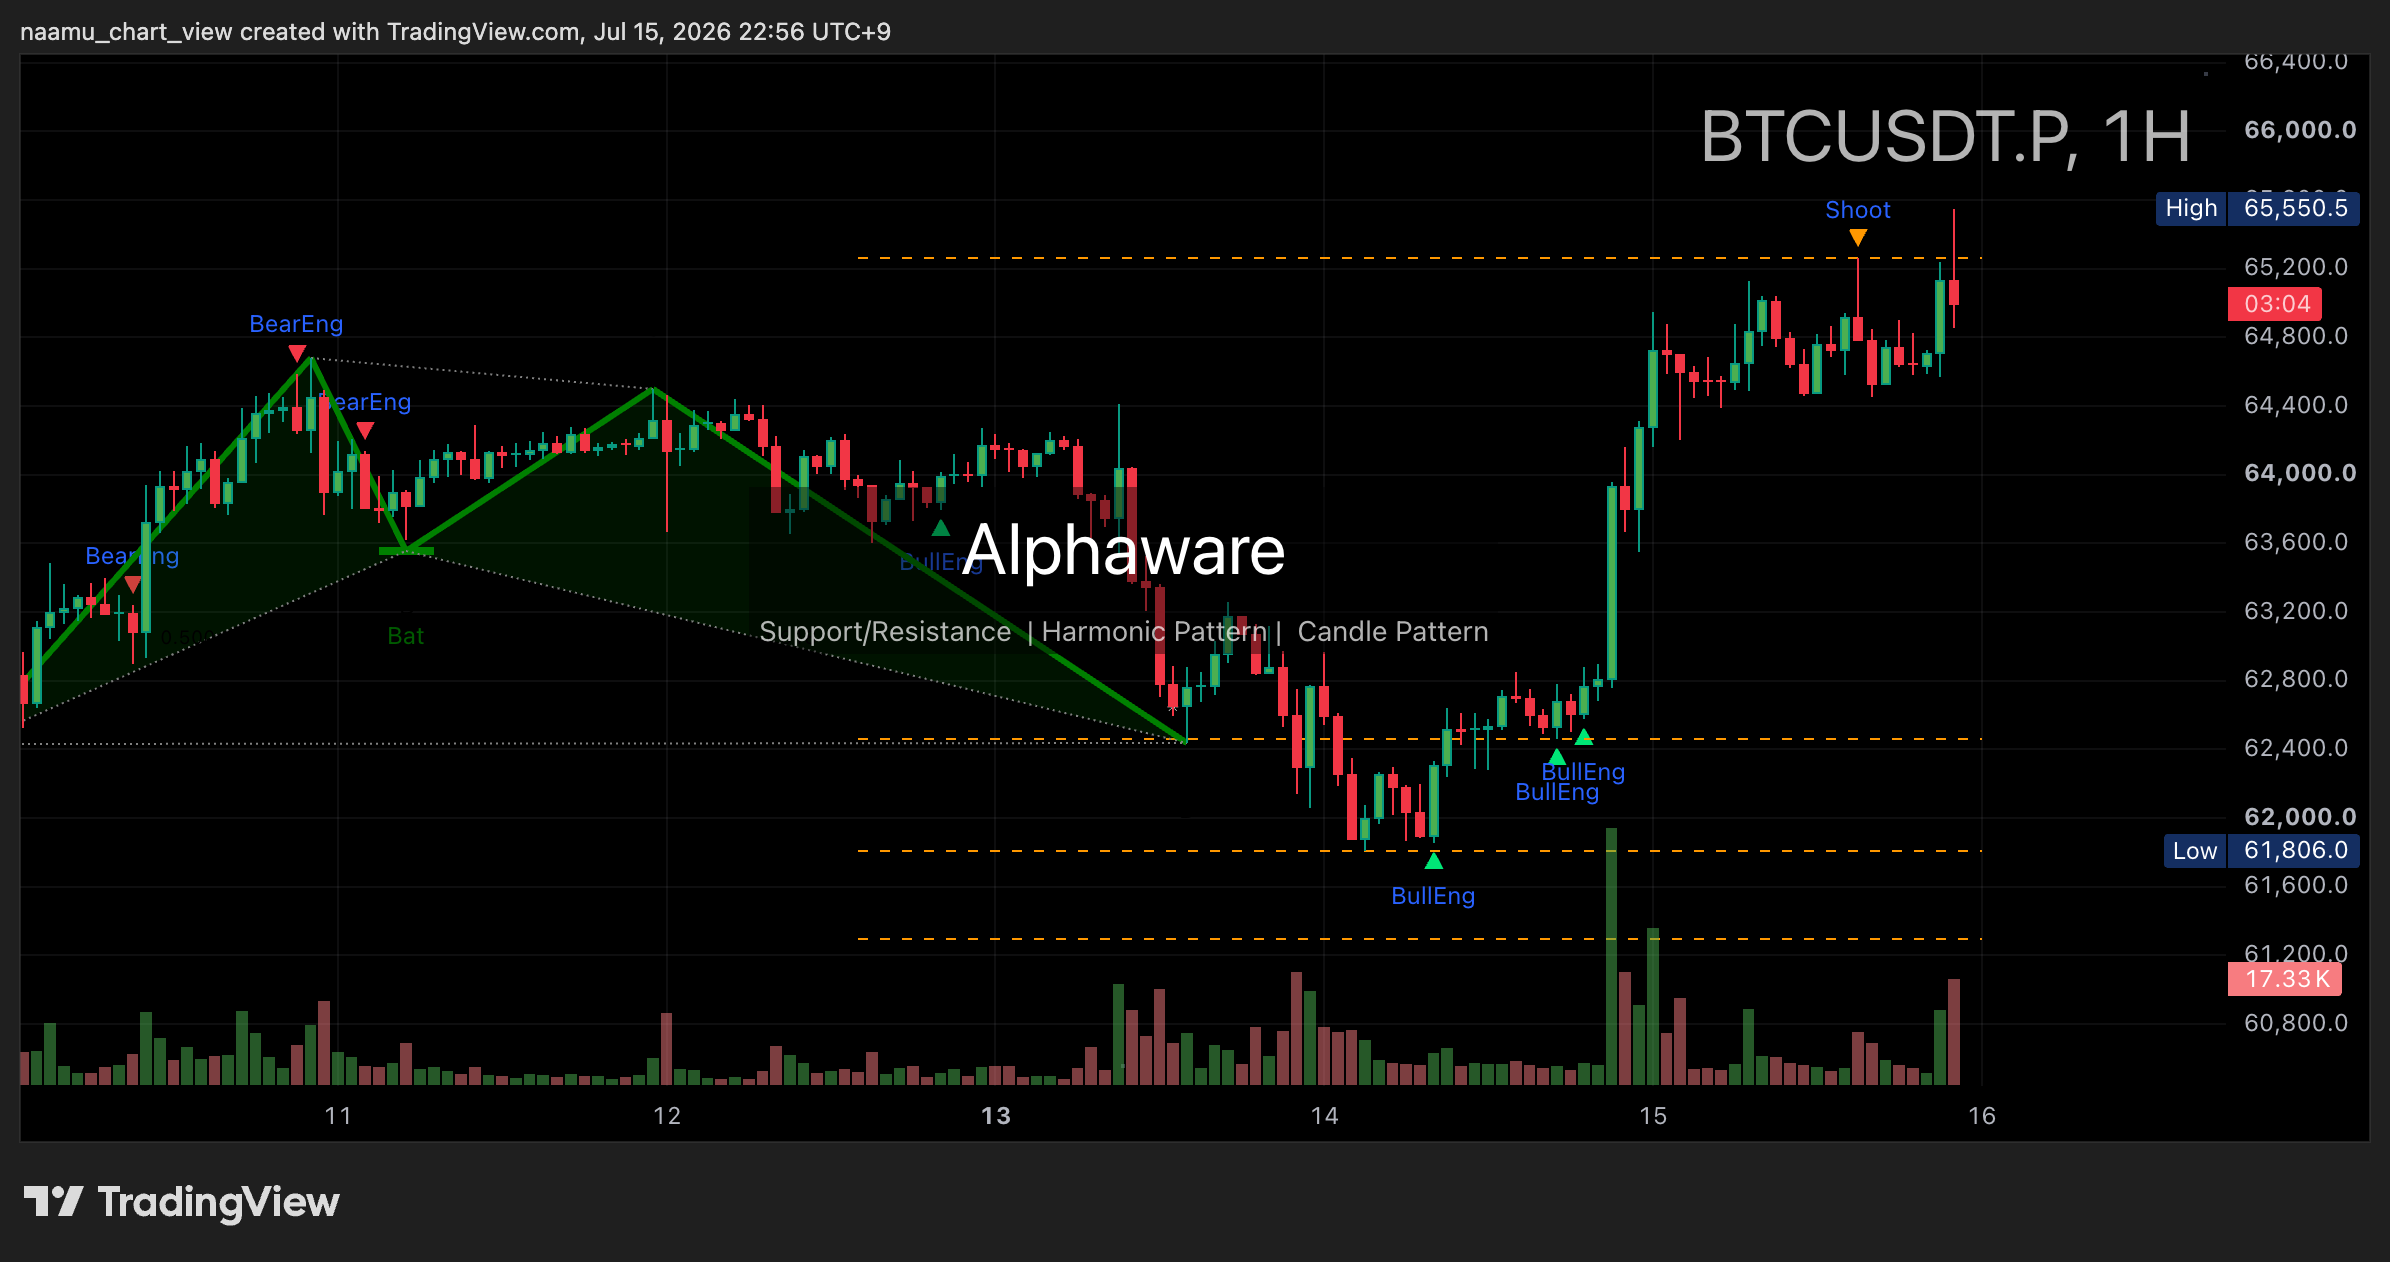
BTC 1-hour: the bridge between short-term volatility and 4-hour structure.
15-minute: confirmation, not a trend signal
The 15-minute chart moves first and is therefore not an independent trend call. It is a supporting view for whether a reaction around $65,000 is holding in the 1-hour and 4-hour charts. A fast move alone is not a buy or sell conclusion.
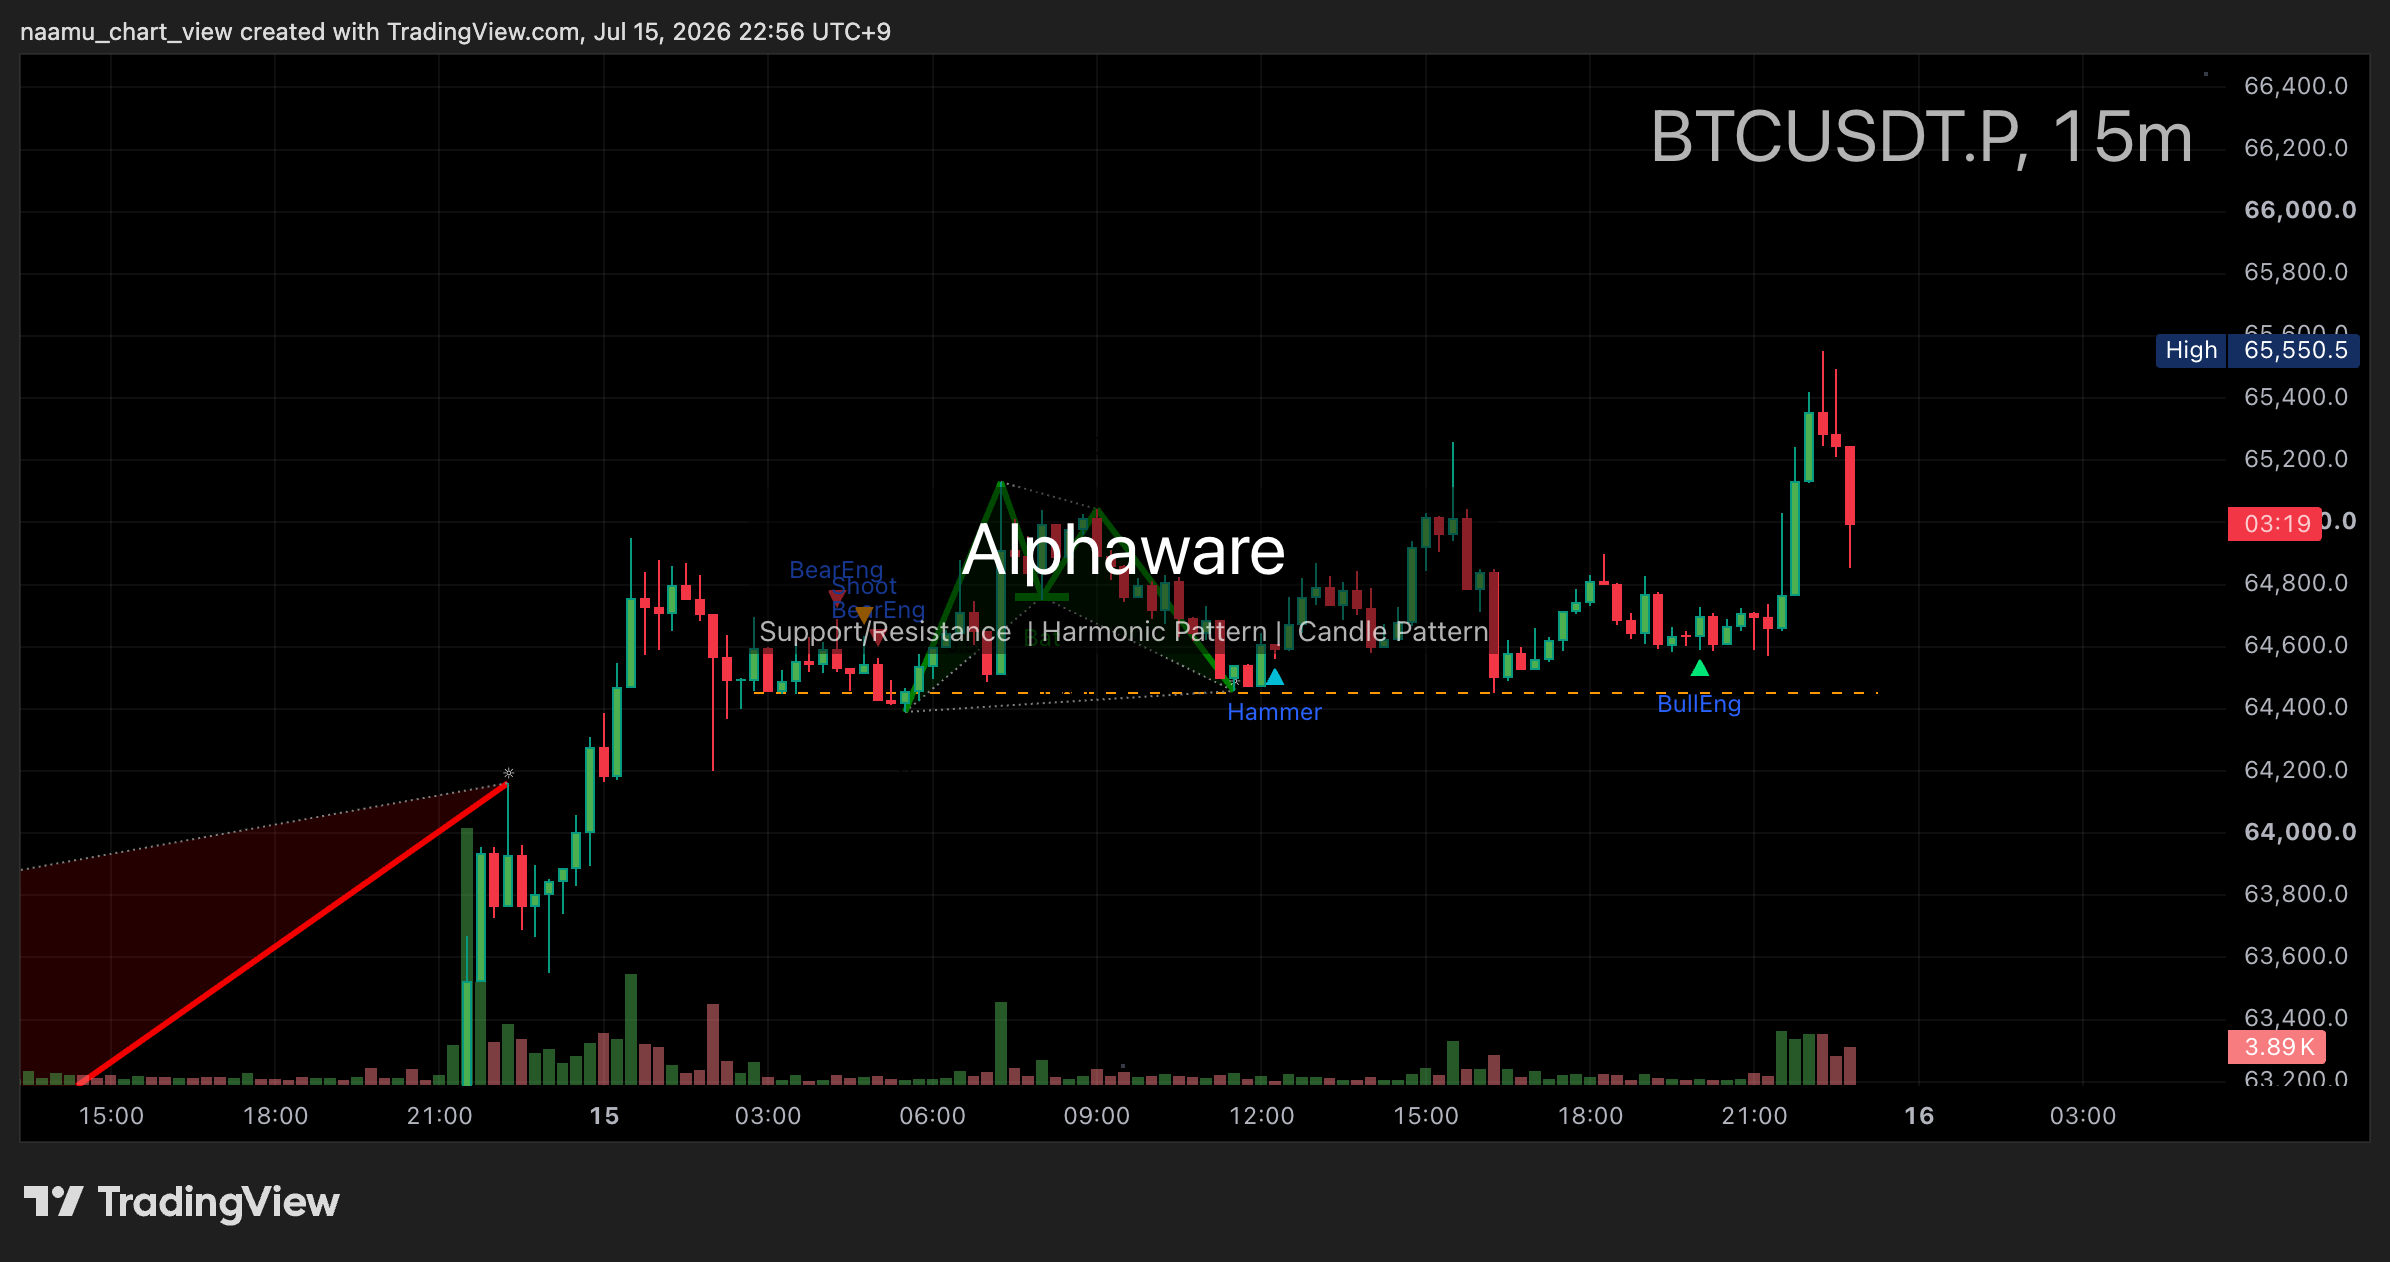
BTC 15-minute: short reactions need confirmation from higher timeframes.
Levels, sentiment, and flow
| Area | Current reference | Watch |
|---|---|---|
| Upper area | $65,100 | Whether a break holds above it |
| Reference | $65,000 | Whether it acts as support or fails after a retest |
| Lower area | $61,705 | Whether the 7-day range low is tested again |
| Sentiment | F&G 25 · Extreme Fear | Whether price recovery accompanies the fear reading |
| Flow | ETF 7-day -$227.26M · funding +0.0100% | Whether spot and leverage start to align |
Extreme fear alone is not a bottom call. Weak ETF flow alongside positive funding can leave leverage crowded. The present mixed view weakens only if spot flow and price recovery begin to confirm one another.
Scenarios — what changes the brief
Base case
BTC continues to work through the range around $65,000. Until the four timeframes realign, level management matters more than a directional bet.
What would add upside weight
- A break above $65,100 that holds on the 4-hour chart
- A 1-hour and 15-minute rebound that does not fade as a single spike
- Better alignment between ETF flow, funding, and price recovery
What would add downside weight
- A loss of $65,000 followed by a failed recovery
- A weaker 4-hour structure and another test of the $61,705 range low
- Further fear alongside weaker spot flow
Short FAQ
Is BTC bullish or bearish now?
Mixed. Fear is elevated, but ETF flow, funding, and price structure do not yet align in one direction.
Does a 15-minute rebound confirm a trend change?
No. The 15-minute chart is a confirmation view; the 1-hour and 4-hour charts need to hold the same direction.
What is the first level to watch?
$65,000. After that, the question is whether a move around $65,100 can actually hold.
Snapshot inputs: BTC daily, 4-hour, 1-hour, and 15-minute charts; Fear & Greed, 7-day ETF flow, and funding. This is an informational market brief, not investment advice.