ATR (Average True Range) measures how far price has been moving over a chosen period. Developed by Welles Wilder, it does not forecast direction. Instead, it converts recent volatility into a price distance that can support stop placement and consistent risk sizing.
How ATR Is Calculated
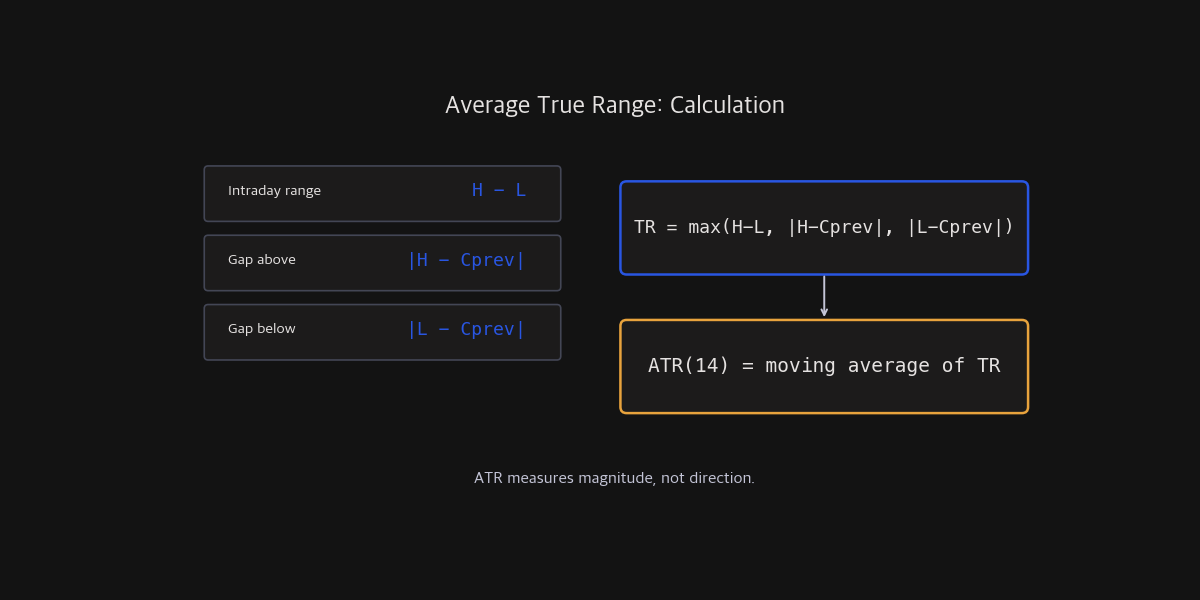
True Range (TR) includes both the current session’s high-low range and any gap from the previous close.
TR = max(High - Low, |High - Previous Close|, |Low - Previous Close|)
ATR(14) = Wilder's smoothing of the latest 14 True Range values
Most charting platforms default to 14 periods and Wilder’s smoothing. The original ATR formula uses Wilder’s smoothing rather than a simple moving average (SMA), so values can differ slightly when platforms use different smoothing conventions.
Reading an ATR Chart

Rising ATR means recent price movement has expanded; falling ATR means it has contracted. An ATR of 2 has a different meaning for an asset priced at 20 than one priced at 200. For cross-asset comparison, consider ATR / Close × 100 as a percentage. ATR rising is not inherently bullish or bearish.
Practical Uses
| Use | Typical parameters | Application rule | Interpretation and caution |
|---|---|---|---|
| Volatility-based stop | ATR(14), 1.5–3 ATR from entry | Shorter trades often use smaller multiples; volatile assets need more room | Place the stop beyond ordinary noise and reduce size as the stop distance grows. |
| Position sizing | Risk budget ÷ (ATR × stop multiple) | Fix risk per trade first, such as 0.5–1% of equity | Reduce units when ATR rises to keep risk comparable across volatility regimes. |
| Trailing stop | Highest high − 3 ATR, as in a Chandelier Exit example | Trend systems commonly test 2–3 ATR | It follows a trend but can cause repeated exits in sideways markets. |
| Volatility breakout | Prior close or open ± 0.5–1 ATR | Require both price-level confirmation and ATR expansion | ATR has no direction, so combine it with price and volume conditions. |
Reducing the period to 7 makes ATR react faster but noisier. Extending it to 20–21 smooths the series at the cost of delay. A multiple is not a magic win-rate setting; it is a risk parameter that should be tested against holding period, gap risk, costs, and the strategy’s reward-to-risk profile.
Limitations and Cautions
- ATR does not show trend direction. It can rise during both rallies and selloffs.
- Smoothing creates lag. ATR may understate risk immediately after a shock and remain elevated after volatility has subsided.
- Values depend on timeframe. Daily and hourly ATR are not directly comparable; use the timeframe on which orders are actually managed.
- It cannot eliminate gap or liquidity risk. Stops may fill beyond their intended price during gaps or in thin order books.
Short FAQ
How is ATR different from Bollinger Bands?
ATR expresses average True Range in absolute price units. Bollinger Bands place standard-deviation envelopes around a moving average, showing both dispersion and price’s relative position.
What is the best ATR period?
Fourteen periods is a sensible starting point. Short-term systems may test 7–10 and swing systems 14–21, but each choice should be validated by asset and timeframe after costs.
Should I sell when ATR is high?
No. ATR has no directional signal. High ATR means movement is large, so its first use is usually adjusting stop distance and position size rather than choosing long or short.
ATR is most useful not for predicting the next move, but for expressing current volatility as a risk distance. Treat its period and multiple as testable strategy parameters, not universal constants.
This article is for education and information only and is not investment advice. Trading involves risk of loss; independently test any method with transaction costs and slippage before use.