Updated November 3, 2026. This article covers the components and calculation of MACD, the lag in its crossover signals, and the conditions for interpreting divergences. Charts and numbers are illustrative examples built from synthetic data, not measured trading results.
MACD measures the distance between two exponential moving averages
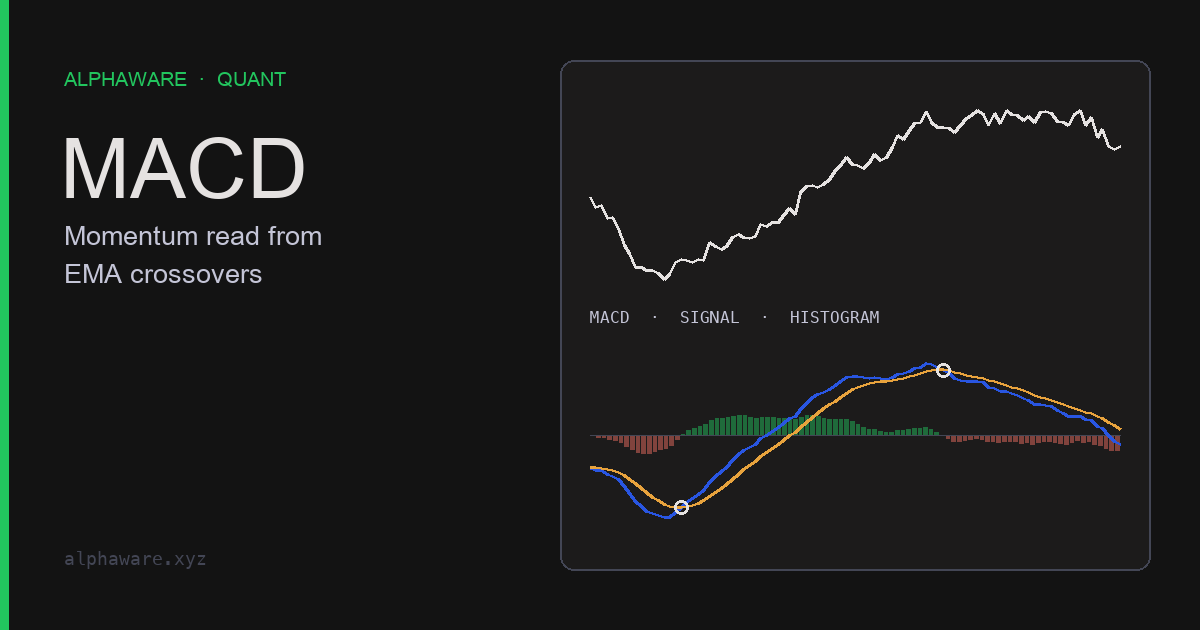
MACD (Moving Average Convergence Divergence) was developed by Gerald Appel in the late 1970s. It subtracts a slow exponential moving average (EMA) from a fast one and shows whether the two averages are moving apart (divergence) or together (convergence).
When price rises steadily, the fast EMA tracks price more closely than the slow EMA, so MACD is positive. When price falls steadily, it is negative. MACD is thus a momentum indicator that summarizes the direction and speed of recent price change as a difference between moving averages.

All three components come from the same closing prices
The default settings documented by StockCharts ChartSchool are 12, 26, and 9.
| Component | Calculation | Meaning |
|---|---|---|
| MACD line | 12-period EMA − 26-period EMA | Distance between the averages; above 0 means the fast average is on top |
| Signal line | 9-period EMA of the MACD line | A further smoothing of the MACD line |
| Histogram | MACD line − signal line | How far the MACD line is from the signal line |
The histogram was added to Appel’s original construction later. Thomas Aspray devised it in 1986 to reduce MACD’s lag and published related work in Technical Analysis of Stocks & Commodities in 1988.

Crossovers arrive after the trend is already under way
Two signals are commonly used.
- Signal-line crossover: The MACD line crossing above the signal line is a bullish crossover; crossing below is a bearish crossover. It coincides with the histogram changing sign. In Korea these are often called golden and dead crosses, but it is clearer to keep them distinct from the terms’ original meaning, a cross between two moving averages of price.
- Zero-line crossover: The MACD line crossing above 0 means the 12-period EMA has moved above the 26-period EMA.
Both signals come from moving averages, so both lag price. The code below checks this on a synthetic path that falls for 40 bars and then rebounds by the same amount over 40 bars. The low is bar 39; the bullish crossover comes after it, and the zero-line crossover later still. On this path, the bullish crossover appears 3 bars after the low (price about 81) and the zero-line crossover 16 bars after it (price about 87.7).
import numpy as np
import pandas as pd

def macd(close, fast=12, slow=26, signal=9):
    ema_fast = close.ewm(span=fast, adjust=False).mean()
    ema_slow = close.ewm(span=slow, adjust=False).mean()
    line = ema_fast - ema_slow
    sig = line.ewm(span=signal, adjust=False).mean()
    return pd.DataFrame({"macd": line, "signal": sig, "hist": line - sig})

def crossovers(df):
    above = df["macd"] > df["signal"]
    up = above & ~above.shift(1, fill_value=False)
    down = ~above & above.shift(1, fill_value=False)
    return list(df.index[up]), list(df.index[down])

flat = macd(pd.Series([100.0] * 60))
assert np.allclose(flat[["macd", "signal", "hist"]], 0)

# Steady trend of 0.5 per bar: MACD converges to (26-12)/2 * 0.5 = 3.5.
trend = macd(pd.Series(100 + 0.5 * np.arange(400)))
assert abs(trend["macd"].iloc[-1] - 3.5) < 1e-6
assert np.allclose(trend["hist"], trend["macd"] - trend["signal"])

# Same shape at ten times the price -> ten times the MACD value.
assert abs(macd(pd.Series(1000 + 5 * np.arange(400)))["macd"].iloc[-1] - 35) < 1e-5

# Fall then rise: the bullish crossover arrives after the low, not at it.
path = pd.Series(np.r_[np.linspace(100, 80, 40), np.linspace(80, 100, 40)])
ups, downs = crossovers(macd(path))
assert path.idxmin() == 39 and ups and ups[0] > 39
zero_up = (macd(path)["macd"] > 0).idxmax()
assert zero_up > ups[0]   # the centerline cross comes even later than the signal cross
With a gentler turn or noisier prices, the lag grows, and in directionless markets crossovers repeat at short intervals. ChartSchool’s examples include a stretch where trends did not follow zero-line crossovers and the result was frequent whipsaws. To use a crossover as a rule, also calculate how many bars after the cross the order fills and how much repeated trading costs in sideways markets.
MACD is in price units, so it cannot be compared across securities
As the second check in the code shows, MACD converges to (26 − 12) / 2 × 0.5 = 3.5 on a steady trend rising 0.5 per bar. Scale the same shape to ten times the price and MACD becomes 35. Because MACD is expressed in price units, the MACD values of securities at different price levels cannot be compared directly, and even for one security, past values become hard to compare after a large change in price level. When comparison is needed, use the PPO (Percentage Price Oscillator), which divides the difference by the slow EMA.
For the same reason MACD has no upper or lower bound like RSI. ChartSchool explains that because MACD is unbounded it is not particularly useful for identifying overbought and oversold levels, and that during sharp moves it can keep extending beyond its historical extremes.
Divergences and the histogram show slowing, nothing more
When price makes a lower low but MACD makes a higher low, it is called a bullish divergence; when price makes a higher high but MACD makes a lower high, a bearish divergence. ChartSchool warns that divergences should be taken with caution. Bearish divergences are common in strong uptrends, and bullish divergences occur often in strong downtrends. A trend can continue for a long time after a divergence appears.
A shrinking histogram means the MACD line is approaching the signal line. It shows change earlier than a signal-line crossover, but it is correspondingly more sensitive to noise. A shrinking histogram is an observation that “recent price change has slowed,” not that “the trend is over.”
The 12-26-9 default and other settings are hypotheses to test
12, 26, and 9 are widely used defaults, but that is no evidence that they are optimal for any asset. Shorter periods respond faster but produce more crossovers; longer periods produce fewer crossovers but lag more. A claim that a particular setting works better for a particular asset remains a hypothesis until it is tested on that asset, timeframe, and cost structure. If you tested several settings, re-check the selection process itself with the walk-forward methods in Preventing backtest overfitting.
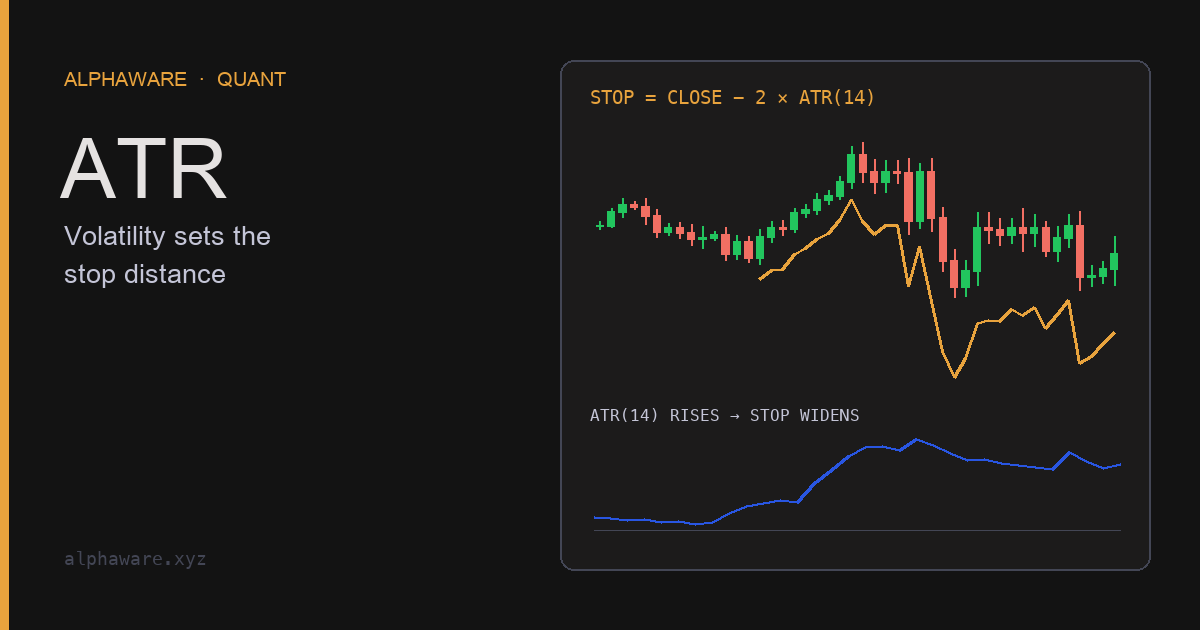
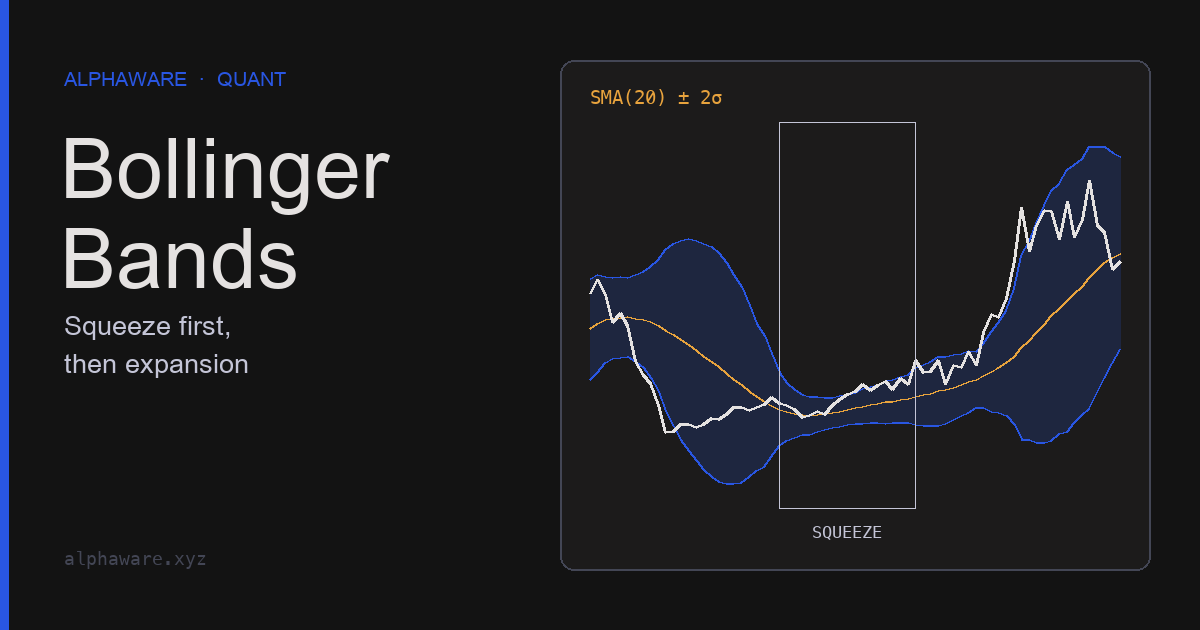
When combining MACD with other indicators, first ask whether the information overlaps. RSI and MACD both come from the momentum of the same closing prices. Counting their agreement as two independent pieces of evidence overstates confidence. If price-range or volatility information is needed, indicators of a different kind, such as Bollinger Bands or ATR, complement each other better.
Sources and scope
- StockCharts ChartSchool: MACD: Appel’s late-1970s development, the 12-26-9 formula, cautions on crossovers and divergences, the unbounded-scale limitation, and PPO.
- TradingView help: MACD: Thomas Aspray’s introduction of the histogram in 1986.
- Stocks & Commodities V.6:8, Thomas Aspray, “MACD Momentum” (1988): article listing stating that Aspray completed the MACD histogram in fall 1986.
- Park & Irwin (2007), “What Do We Know About the Profitability of Technical Analysis?”: literature review covering data snooping and ex post rule selection in technical trading studies.
- This article explains how MACD is calculated and how its signals behave. It does not claim that any crossover or divergence rule earns returns, and it is not investment advice.