Updated November 3, 2026. This article separates behavior confirmed in TradingView’s official Pine Script v6 documentation from the validation procedure we propose. Scripts and code show structure only; they do not demonstrate trading results or the validity of any strategy.
Pine Script is a tool for quick prototypes on the chart
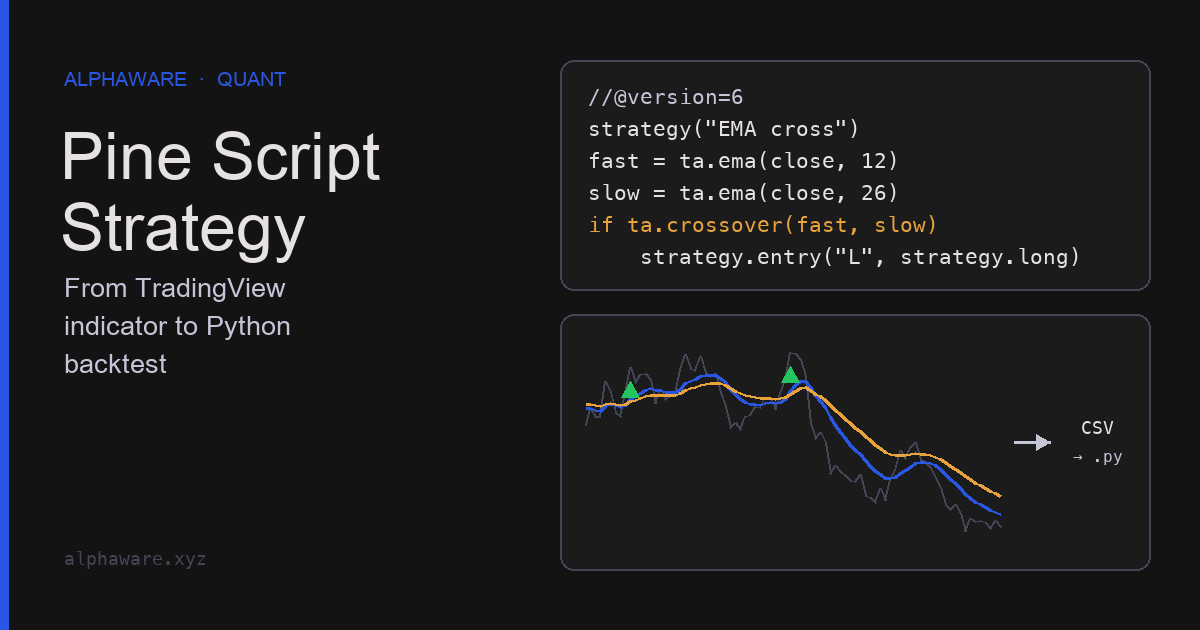
Pine Script is the scripting language that runs on TradingView charts. Scripts fall into two kinds depending on their declaration. indicator() computes values and draws them on the chart; strategy() fills simulated orders through a built-in broker emulator and produces a performance report in the Strategy Tester. The current documentation is for v6; when moving older scripts, check the official v6 migration guide.
The advantage is that you can see an idea on the chart right away. The drawback is that the validation procedure is hard to design freely. Splitting data into several test periods, logging every parameter tried, and combining other data are easier to control in an external environment. The flow in this article is make the rule precise in Pine, then port the same rule to Python and validate it there.
Indicator script: mark crossover signals on confirmed bars
A moving-average crossover has a simple rule, which makes it a good porting example. It is not meant to show that the signal works.
//@version=6
indicator("MA Crossover Signal", overlay = true)

fastLen = input.int(20, "Fast length", minval = 1)
slowLen = input.int(50, "Slow length", minval = 2)

float fast = ta.sma(close, fastLen)
float slow = ta.sma(close, slowLen)

plot(fast, "Fast SMA", color.blue, 2)
plot(slow, "Slow SMA", color.orange, 2)

// On the realtime bar a cross can appear and disappear, so mark only confirmed bars
bool buySignal  = ta.crossover(fast, slow) and barstate.isconfirmed
bool sellSignal = ta.crossunder(fast, slow) and barstate.isconfirmed

plotshape(buySignal, "Buy", shape.triangleup, location.belowbar, color.green, size = size.small)
plotshape(sellSignal, "Sell", shape.triangledown, location.abovebar, color.red, size = size.small)
ta.crossover(a, b) is true when a is greater than b on the current bar and a was less than or equal to b on the previous bar. The realtime bar keeps changing until its close is confirmed, so signals drawn on historical bars can differ from what you saw in real time. The barstate.isconfirmed condition is one way to reduce that difference.
When pulling other symbols, check lookahead and trading hours
request.security() fetches data from another symbol or timeframe. According to the official documentation, lookahead defaults to barmerge.lookahead_off; requesting higher-timeframe data with lookahead_on without offsetting the value by one bar ([1]) can leak future information into historical bars. gaps controls whether bars with no new value get na (gaps_on) or carry the last confirmed value (gaps_off, the default).
The example below computes the correlation of the two symbols’ returns. Correlation between price levels can come out large even without any relationship when both series trend, so comparing rates of change is easier to interpret.
//@version=6
indicator("BTC vs DXY return correlation", overlay = false)

lenInput = input.int(20, "Correlation length (bars)", minval = 2)

// Compute the 1-bar rate of change on each symbol's own bars; keep lookahead at its default (off)
float btcRet = request.security("BINANCE:BTCUSDT", timeframe.period, ta.roc(close, 1))
float dxyRet = request.security("TVC:DXY", timeframe.period, ta.roc(close, 1))

float corr = ta.correlation(btcRet, dxyRet, lenInput)

plot(corr, "Correlation", corr >= 0 ? color.red : color.green, 2)
hline(0, "Zero", color.gray, hline.style_dashed)
Mixing symbols with different trading hours needs care. Crypto trades on weekends but the dollar index does not, so with the default (gaps_off) the last DXY value repeats on bars when it is closed, and those repeats enter the correlation. Consider comparing on daily or longer bars, or separately handling only bars where both symbols traded. We did not find support for the claim that this correlation times entries.
State costs and fill assumptions in strategy()
A Strategy Tester result is the result of the assumptions you set. According to the official documentation, the broker emulator by default fills market orders at the next bar’s open, and parameters such as process_orders_on_close change this behavior. Default commission is set with commission_type and commission_value, and slippage with slippage in ticks.
//@version=6
strategy("MA Crossover Strategy", overlay = true,
     initial_capital = 10000,
     default_qty_type = strategy.percent_of_equity, default_qty_value = 100,
     commission_type = strategy.commission.percent, commission_value = 0.1,
     slippage = 2)

fastLen = input.int(20, "Fast length", minval = 1)
slowLen = input.int(50, "Slow length", minval = 2)

float fast = ta.sma(close, fastLen)
float slow = ta.sma(close, slowLen)

bool longEntry = ta.crossover(fast, slow)
bool longExit  = ta.crossunder(fast, slow)

if longEntry
    strategy.entry("Long", strategy.long)
if longExit
    strategy.close("Long")
The 0.1% commission and 2-tick slippage are illustrative assumptions. Set real values from the venue’s fee schedule, tick size, and order size, and check how sensitive the result is by varying them. The documentation notes that strategy report performance data can be downloaded as an XLSX file, and the export includes the Properties tab settings. Recording these settings makes it easier to trace differences when comparing with a Python reproduction.
When porting to Python, separate signal time from fill time
To reproduce Pine’s default behavior in Python, a signal confirmed at a bar’s close must take effect from the next bar. Assuming a fill at the same bar’s close puts orders into the backtest that could not actually have been placed.
import numpy as np
import pandas as pd

def crossover(a, b):
    """Same definition as Pine ta.crossover(a, b): a > b on this bar, a <= b on the previous bar."""
    return (a > b) & (a.shift(1) <= b.shift(1))

def crossunder(a, b):
    return (a < b) & (a.shift(1) >= b.shift(1))

def ma_cross_positions(close, fast=20, slow=50):
    f, s = close.rolling(fast).mean(), close.rolling(slow).mean()
    buy, sell = crossover(f, s), crossunder(f, s)
    # Signal confirmed at the bar close -> held from the next bar (Pine default: fill at next open)
    state = pd.Series(np.nan, index=close.index)
    state[buy] = 1.0
    state[sell] = 0.0
    signal = state.ffill().fillna(0.0)
    position = signal.shift(1).fillna(0.0)
    return pd.DataFrame({"fast": f, "slow": s, "buy": buy, "sell": sell,
                         "signal": signal, "position": position})

def net_returns(open_, position, cost_rate=0.001):
    """Open-to-open return times position, minus cost whenever the position changes."""
    ret = open_.pct_change().shift(-1).fillna(0.0)   # from open t to open t+1
    trades = position.diff().abs().fillna(position.abs())
    return position * ret - trades * cost_rate

rng = np.random.default_rng(3)
n = 400
close = pd.Series(100 * np.exp(np.cumsum(rng.normal(0, 0.01, n))))
open_ = close.shift(1).fillna(close.iloc[0])          # hypothetical data: open = previous close
out = ma_cross_positions(close)
pnl = net_returns(open_, out["position"])

# 1) the position does not change on the bar where the signal fires
first_buy = out.index[out["buy"]][0]
assert out.loc[first_buy, "position"] == 0.0 and out.loc[first_buy + 1, "position"] == 1.0
# 2) changing future prices does not change past signals (no lookahead)
shocked = close.copy()
shocked.iloc[300:] *= 1.5
assert out["signal"].iloc[:300].equals(ma_cross_positions(shocked)["signal"].iloc[:300])
# 3) cross events occur only after the slow window is filled
assert not out[["buy", "sell"]].iloc[:50].any().any()
# 4) costs occur only on bars where the position changes
assert np.isclose((out["position"].diff().abs().fillna(0) * 0.001).sum(),
                  (out["position"] * open_.pct_change().shift(-1).fillna(0) - pnl).sum())
The second check, “changing future data leaves past output unchanged”, is a simple way to confirm that ported code contains no lookahead. Also compare Pine’s list of trades with Python’s entry and exit times on the same data to confirm they match. Only then move on to parameter search and chronological validation. Split methods are covered in the overfitting checks article.
Compare plans by feature limits and check prices on the official page
TradingView offers a free Basic plan and paid plans including Essential, Plus, Premium, and Ultimate. The official pricing page compares limits by plan, such as indicators per chart, charts per tab, alerts, saved layouts, historical bars, and second-based timeframes. Prices and limits vary with billing period and promotions and change over time, so this article does not list numbers. Check the official TradingView pricing page for current information.
When choosing a plan, look first at the items that directly affect strategy validation: how many scripts you need on one chart at once, how many historical bars a backtest needs, and which timeframes you will use.
Referral disclosure: the TradingView pricing link is an Alphaware referral link. According to TradingView’s referral program page, a new user who has never had an account and becomes a paid member within 3 months of signing up through a referral link receives a $15 discount coupon, and the referrer also receives a reward. See TradingView’s official page for the conditions.
Sources and scope
- Pine Script v6 Strategies: broker emulator fill timing,
commission_type,commission_value,slippage, and XLSX report export. - Pine Script v6 Other timeframes and data:
lookaheadandgapsbehavior ofrequest.security(). - Pine Script v6 migration guide: changes when moving older scripts to v6.
- TradingView pricing: plan names and per-plan feature limits.
- TradingView referral program: conditions for the referral discount.
- This article does not claim that a moving-average crossover or a BTC-DXY correlation is a profitable rule; the examples illustrate porting and validation only.